Market commentary equities: Markets buoyed despite high valuations and inflation concerns – central banks’ next moves awaited
Equity markets have been boosted by liquidity, but high valuations suggest a potential for a pull back. The Fed’s fight against inflation is being undermined by weakness in regional banks and the wage-price spiral, which adds to inflationary pressures. In our market commentary, we draw parallels with historic valuations and explore central banks’ position in the current economic environment.


Andjelka Bannes, CFA
Executive Director Equities
Equity markets had a strong positive first quarter in 2023. The MSCI World, MSCI Europe and MSCI EM gained 5.83%, 8.61%, and 2.12% respectively (all in EUR terms). The rally started in October 2022, and since then the S&P 500 has gained almost to 20%. It has been driven by a significant influx of liquidity into the system after the collapse of Silicon Valley Bank (SVB) and other regional lenders in March. The failure of SVB and the subsequent fallout – including the forced merger of Credit Suisse and UBS – has convinced investors that the US Federal Reserve will not continue to raise interest rates to fight inflation. Additionally, short covering in the tech sector and falling inflation numbers have contributed to the rally.
In terms of sectors and styles, growth style/large cap techs benefited from the liquidity injection and the repricing of the yield curve, gaining +7.24% relative to the broader market. Quality also outperformed but to a lesser extent. Value and momentum were the weakest factors, while energy and banks sold off. Defensive style also underperformed as investors rotated into growth stocks.
The start of a new bull market or is this a false dawn?
In bear markets, it is necessary to change our perspective in several ways. For instance, an “up-move” can be considered a reaction because it goes against the main trend. In a bear market, every decline is punctuated by a secondary reaction, which may come in two or three phases. For example, the Nasdaq lost 84% during the 30-month tech bubble burst from March 2000 to October 2002. However, over the same period, there were seven instances when the Nasdaq rallied by 24%, 42%, 24%, 25%, 31%, 51%, and 59%, respectively. Similarly, over the same 30-month period, the S&P 500 fell by 51%, but had at least four instances of gains of 20%+. Hence, it is possible to see significant positive moves even in a bear market.
Figure 1: Nasdaq Index – Seven rallies in the bear market between 2000 and 2002

Of course, in any bear market there is always the possibility that the rally will turn out to be a primary reversal. You never step into the same river twice, but we can listen for echoes of the past that may indicate what the future may hold.
Current valuations remain high in historical comparison
Throughout history, we have witnessed four notable super bubbles that have had a lasting impact on the global economy.
- The first was the Great Depression of the early 1930s, which lasted three years and saw the Dow Jones Industrial Average (DJIA) plunge by a staggering 89%, from a high of 381 in September 1929 to a low of 41 in July 1932.
- The second super bubble was the Japanese stock market crash of 1989, also known as the “lost decade”, where the Nikkei 225 index experienced a prolonged downturn that lasted until 2003, resulting in an over 80% loss in its value.
- The third super bubble was the tech bubble, commonly referred to as the dot-com bubble, where the unsustainable valuations of internet companies led to a significant stock market crash, with the Nasdaq falling by 84%.
- The fourth bubble is one we have today and commonly referred to as the “everything bubble”.
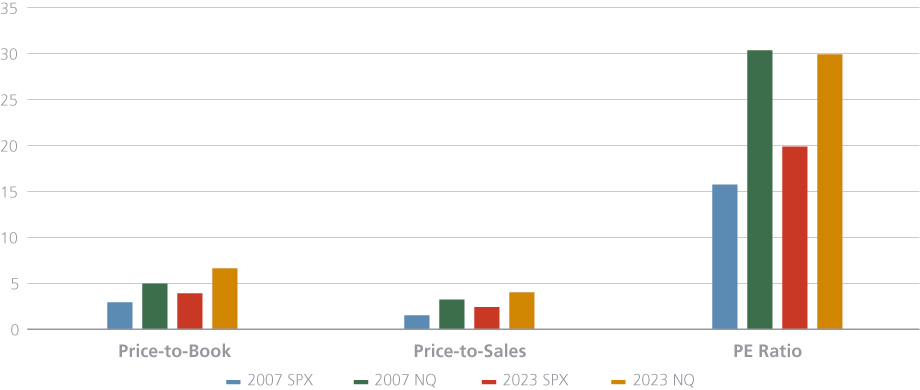
Current market valuations, even when considering the sell-off in 2022, would suggest that this is the largest bubble of all time compared to the previous super bubbles. Valuations have only returned to the peak levels of 2000, with the S&P price-to-sales ratio at 2.36x, slightly above the 2000 peak level of 2.2x. The current price-earnings, and price-to-book of the S&P 500 and the Nasdaq are still higher than their 2007 peaks. Given the historical evidence, current valuations are still high and have a potential for a decline in the near-to-medium term.
Figure 2: Valuations S&P 500 & Nasdaq – Current vs. Peak 2007
What actions has the Fed taken?
Central banks are grappling with the challenge of inflation, which has recently become a defining issue for them. The Federal Reserve has made it clear that fighting inflation is its top priority, and over the last two years it has pursued the most aggressive rate hikes in history. The question remains, however, whether it will be able to suppress demand sufficiently to tame inflation, or whether problems such as the failure of the SVB bank will force it to cut interest rates before they can achieve their goal.
The failure of the SVB has prompted the Fed to reverse course and inject liquidity into the system to avoid potential repercussions. This has led to an increase in the money supply and an expansion of the base money supply, which undermines the Fed’s fight against inflation and its tightening policies. Moreover, due to the banking crisis, there is now a significant discrepancy between the Fed’s projected interest rate policy and the market’s perception of it. Although Jerome Powell has hinted at the possibility of a rate pause for the rest of the year, the market expects a peak interest rate of 5.12% in June, followed by a subsequent decrease.
Figure 3: Implied Overnight Rate & Number of Hike/Cuts and implied Fed Funds Target Rate

To compound matters, the strong demand for labour has led to higher labour costs for companies, which in turn have had to raise the prices of their products and services to maintain profitability. This has triggered a self-reinforcing cycle in most Western economies, known as the wage-price spiral, which central banks aim to avoid as it adds to inflationary pressures.
Moreover, most Western economies are facing an ageing population, with a larger number of elderly individuals drawing on resources for their livelihoods, while there are fewer young people available to fill multiple jobs.
In this context, some central banks such as Australia and Canada appear to be becoming more dovish and the pressure is mounting towards easing.
Could we see a second wave of inflation just like in the 70s?
The second wave of inflation in the 1970s was more severe and prolonged than the first one. The first wave of inflation in the 1960s was caused by imprudent fiscal policies such as increased government spending on the Vietnam War and social programmes, which led to increased demand and rising prices. However, this inflation was relatively mild compared to the second wave. The second wave of inflation was the deadly one caused by a combination of factors, including rising oil prices, increased government spending on social programmes, and expansionary monetary policy. Overall, the second wave of inflation in the 1970s was a more significant and more complex economic challenge than the first wave, and its impact was felt for many years after its end.
The persistence of inflation has been reflected in the economic data, which remains incredibly resilient: unemployment rates in many economies are still below pre-pandemic levels; PMI business surveys have shown an improvement in the economic outlook in the major developed economies; the headline composite survey has risen above 50 into expansionary territory in the US and UK, while the eurozone has also remained in positive territory. In Europe, inflation remains broad-based and is becoming more entrenched. EU services inflation was close to 1% in January, well above the historical range. In China, the reopening of the economy after the pandemic is feeding a strong rebound in economic activity. The money supply is growing more than in the West, which may lead to increased domestic spending and capital for investments. The change in new credit issued as a percentage of GDP is rising. Should demand from China increase however, inflation may be sparked.
Figure 4: Core inflation still approximately 5% (latest quarter)

Furthermore, as like in the 70s we can observe that:
- A switch from QT to QE triggered by the SVB failure undermining the tightening policies of the Fed as described previously.
- Renewed upward pressure on energy prices – OPEC and its allies, including Russia, agreed on 2nd of April 2023 to widen crude oil production cuts to 3.66 million barrels per day (bpd), or 3.7% of global demand. The surprise announcement is inflationary. Since the announcement, crude WTI and Brent prices have risen by 7% and 6% respectively.
- Global economic instability/ geopolitical tensions could have enormous implications for fiscal and monetary policy.
Figure 5: Performance Commodities

The Russia-Ukraine war is perceived by markets as distant and almost irrelevant to the global market performance. However, the war is a significant factor that could disrupt the already fragile global financial system. The conflict in Ukraine has already had a huge impact on global commodity prices, leading to higher inflation and causing Europe to reassess its energy strategy. If tensions escalate further, it could have further impact on inflation, industrial structure, and living standards for the foreseeable future.
Meanwhile, markets are keeping a close eye on Sino-US relations amid fears that tensions over Taiwan could escalate. China has no desire to invade Taiwan and it believes that Taiwan should be re-integrated over time. China expects the pro-China KMT party to win in the upcoming Taiwanese elections in 2024 which would also be in line with Xi Jinping’s long-standing statement that 2028 would be the year when the two sides ‘come together’. The United States is aware of this scenario and it remains to be seen whether it will allow this to happen or provoke China into taking action before 2024.
Finally, the possibility of further instability in Israel, and the wider Middle East, has increased since Netanyahu took office. This could impact crude oil prices and markets.
Summary
Equity markets have rallied from September 2022 into Q1 2023. More recently, the rally has been driven by a liquidity injection from the Fed following several bank failures. However, there are concerns about high valuations and a possible pullback.
The Fed’s efforts to control inflation are being hampered by the weakness of regional banks on the one hand, and factors that add to inflationary pressures such as an overall resilient US economy, labour shortages, sticky inflation and the resulting wage-price spiral on the other.
We are cautious about the outlook and believe that market volatility could continue, with downside risks, as we enter the second quarter. Finally, geopolitical tensions should not be ignored as they are another significant factor that could negatively impact the already fragile financial system.